
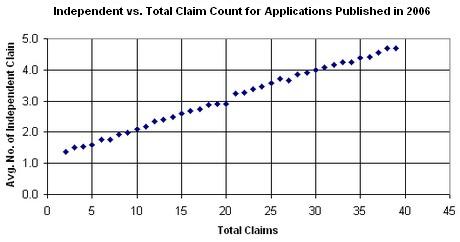
Part II of my new series on evidence based prosecution focuses simply on a descriptive feature of the patent application. How many independent claims should you file? Although we don’t answer that question here, we can answer the question of how many are usually filed. Using data collected from patent applications published thus-far in 2006, I constructed the chart above comparing the average number of independent claims in a patent application to the total number of claims in the patent.
The results fit very nicely to the equation:
y = 0.0921x + 1.1993, where y is the number of independent claims and x is the total number of claims.
The fit has a very high R(^2) value of 0.9967. The actual predictive value of of the expected number of independent claims loses its power when you consider the variance of the average number of independent claims. In the chart below, high-low bars mark the rang associated with one standard deviation above and below the average number of independent claims.

The equation does predict that an application with 20 total claims will include 3 independent — that is perhaps the most common combination of claims. As the total claims pass 40, the variance begins to climb even further.
Back to Part I: As a follow-on to my earlier post on Sensitivity to Claim Fee Variation, the following figure is an overlay showing the difference between patents the few months before and after December 8, 2004. On that day, the PTO instituted a new fee schedule that increased the cost of filing a patent and added an additional fee for every claim filed beyond twenty. The data here is slightly different from that reported earlier to remove applications that published outside (before or after) one month from the eighteen–month publication time-line.

Notes: Evidence Based Prosecution:
Generalia:
- Thanks to Jeff Steck for his suggestion of the new title of the series.


