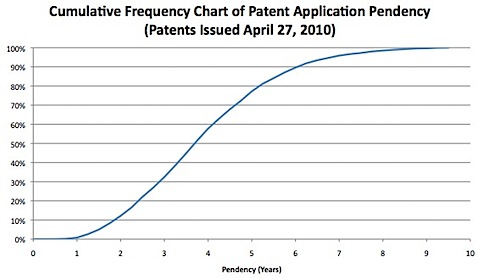
The following table looks at the number of years-in-prosecution for utility patents issued on April 27, 2010. I divided the issued patents into four groups depending whether the patent claims priority to either a foreign application or a US non-provisional. The table reports the average pendency for each group as well as the relative number of patents in the group.
|
Average Pendency of Utility Patents Issued April 27, 2010 (Filing Date to Issue Date, Not Including Priority Claims) |
Claim Priority to Foreign Application |
||
|
Yes |
No |
||
|
Claim Priority to US Non-Provisional Application |
Yes |
2.8 years (6% of Patents) |
3.2 years (15% of Patents) |
|
No |
4.1 years (33% of Patents) |
4.1 years (45% of Patents) |
|
I used the same patent application pendency data to create the cumulative frequency chart below. As can be seen, the median pendency is a bit under four years. 90% of patents issue within six years. 
I’m not so sure this charge is statistically meaningful… I can’t see how a claim of priority could really change the delay. Does the USPTO give priority to applications with a US provisional? Even if so, typically, you’d need to add on a year to that number because the provisional was filed a year before.
How effective is the increase if more and more people are not keeping up with the maintenance fees and letting patents go abandoned?
Conversely, how far into the future are any of these beneficial effects actually going to be felt by the patentees?
Paul, if you put it to a vote to have deferred examination in the US, you would probably see a similar divide between the pecunious and the impecunious, with the rich folks being strongly against relative poor folks being strongly in favor.
And it is easy to figure out why.
This pendency data is bad enough. But without the TOTAL pendency from the ORIGINAL filing dates INCLUDING serial parent and possibly grandparent non-provisional application pendencies [21% of issuances by adding the 6% to the 15% above] the TRUE or REAL pendency is not provided, and is undoubtedly considerably worse.
P.S. There have been some recent allegations that many applicants are not really interested in more rapid issuance, and presumably would rather have more pendency for more claim amendment opportunity and/or term extension. That is partially true, but to what extent? I wonder if there is really any accurate survey data on that, and if so who was asked? I suspect it is making assumptions based the low number of applicants requesting special expedited prosecution, but that can have a number of disadvantages in the U.S.
How does this compare to the official data from the PTO?
HAPPY BIRTHDAY DENNIS!
Dennis,
Thanks for the clarification, you graph now makes perfect sense to me. Pendency has definitely gone up and that’s not good for most applicants (unless you happen to be pharma who would just as soon get PTA on the back end of the patent term).
EG – I added an explanation above.
Dennis,
I’m not sure I understand what this chart is supposed to show. Are you showing what percent of patent applications are granted after a certain number of years.
Comments are closed.